EBSD map GUI
This GUI allows to analyze quantitatively slip transmission across grain boundaries for an EBSD map.
The Matlab function used to run the EBSD map GUI is: A_gui_plotmap.m
This includes:
Loading EBSD data
For more details about the format of the EBSD data, see also the page: Experimental data.
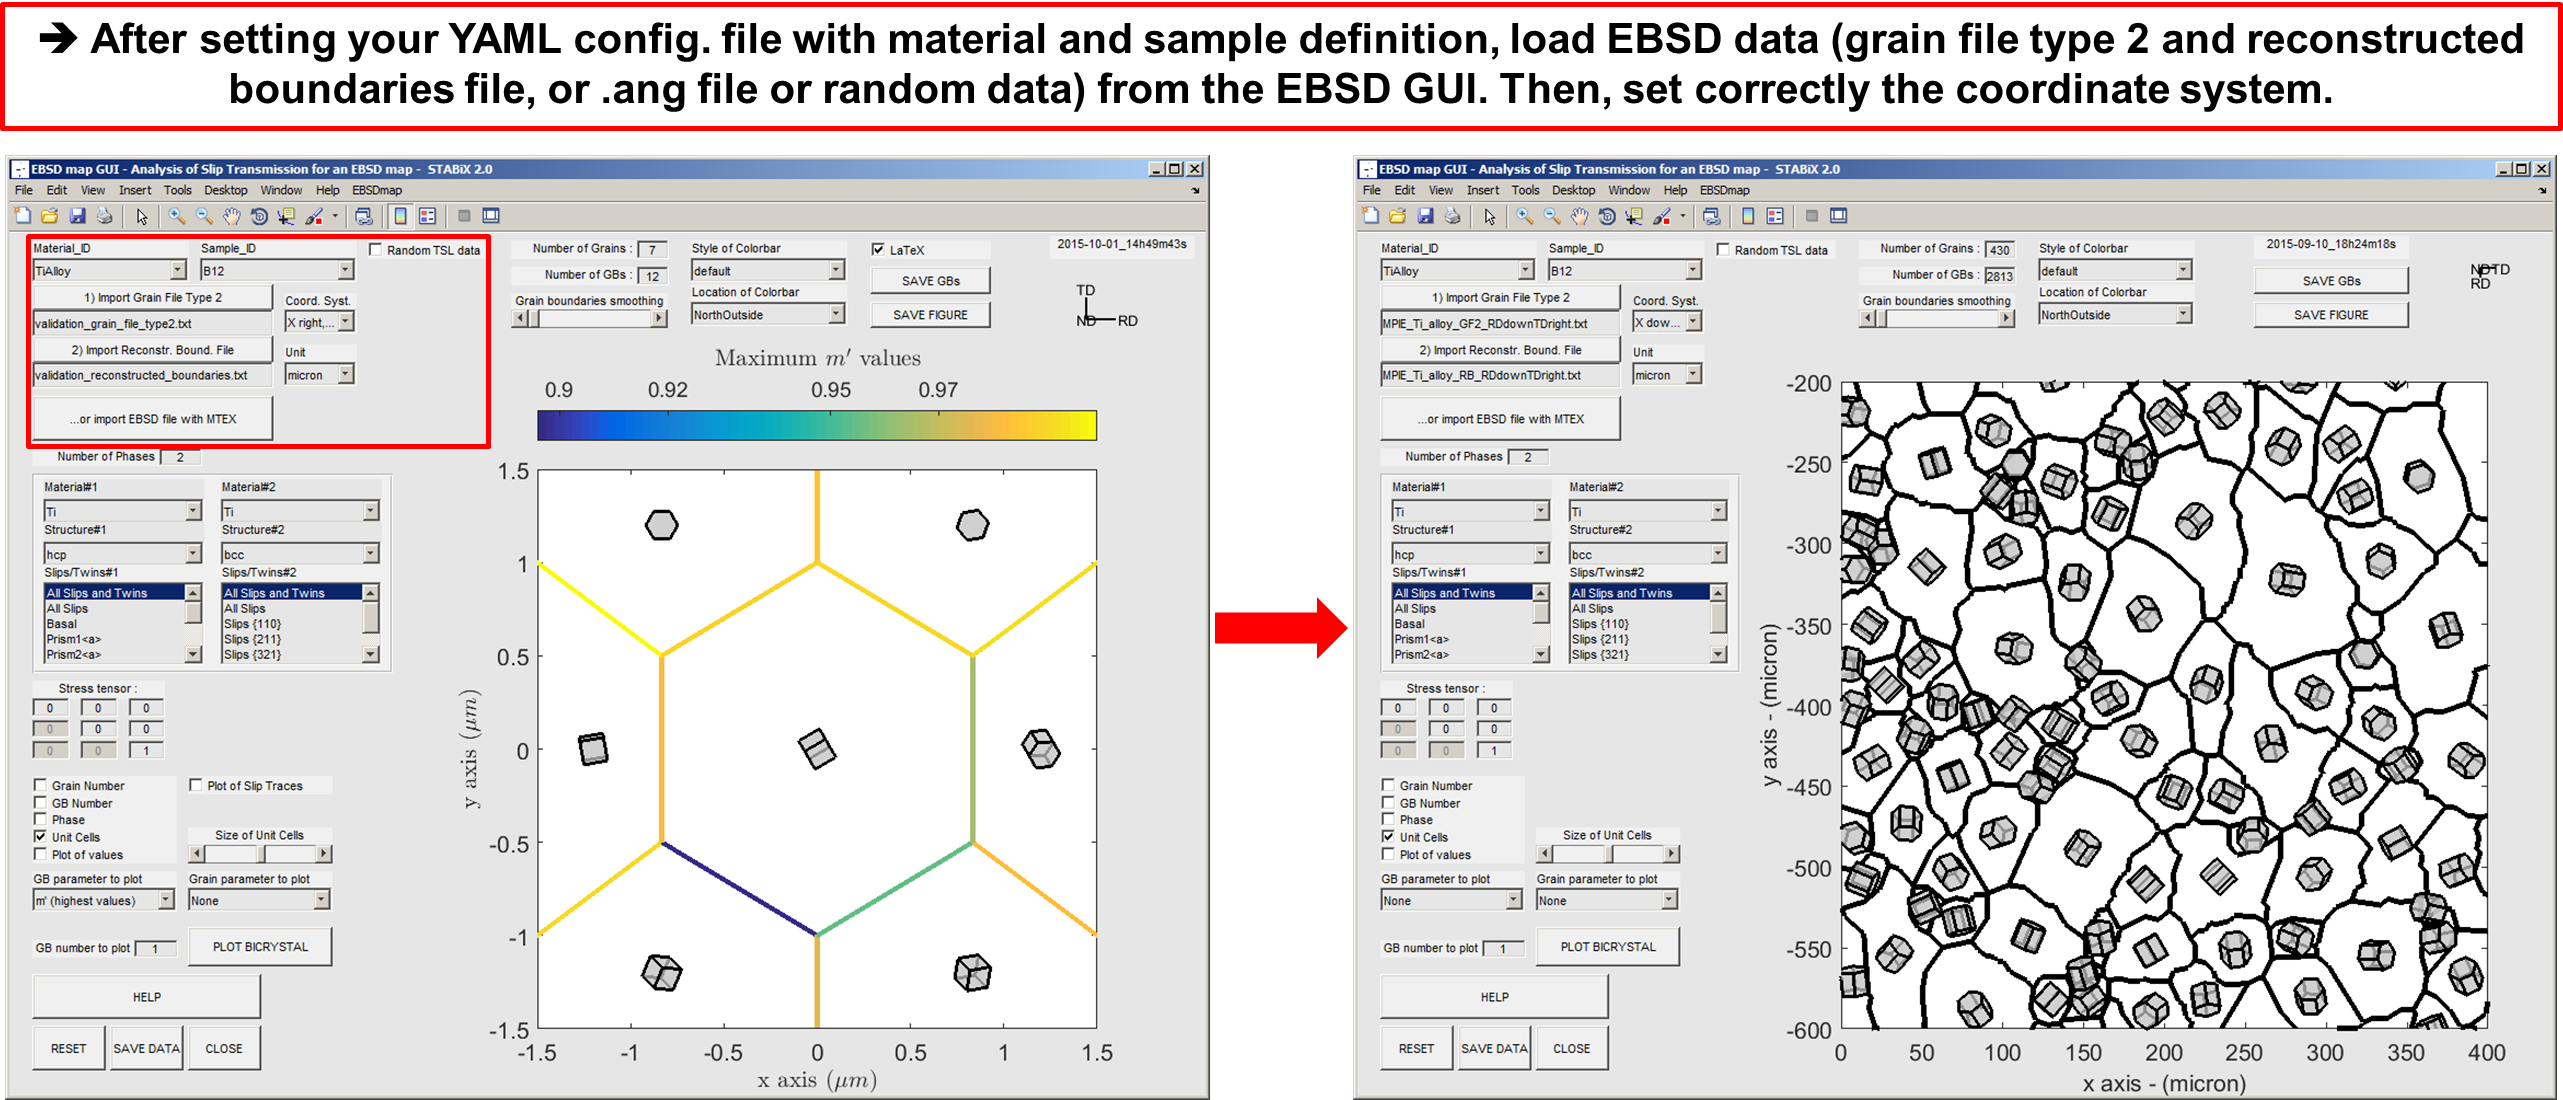
Figure 15 The different steps to load data into tge EBSD map GUI.
Warning
Be careful when importing datasets with high number of grains (e.g. > 300 grains), the loading and plotting steps may take few minutes…
Smoothing GBs segments
The smoothing algorithm allows to decrease the total number of grains boundaries in order to speed up calculations and plots. Move the slicer in the right direction to decrease the total number of grains boundaries (i.e. segmentation reduction).
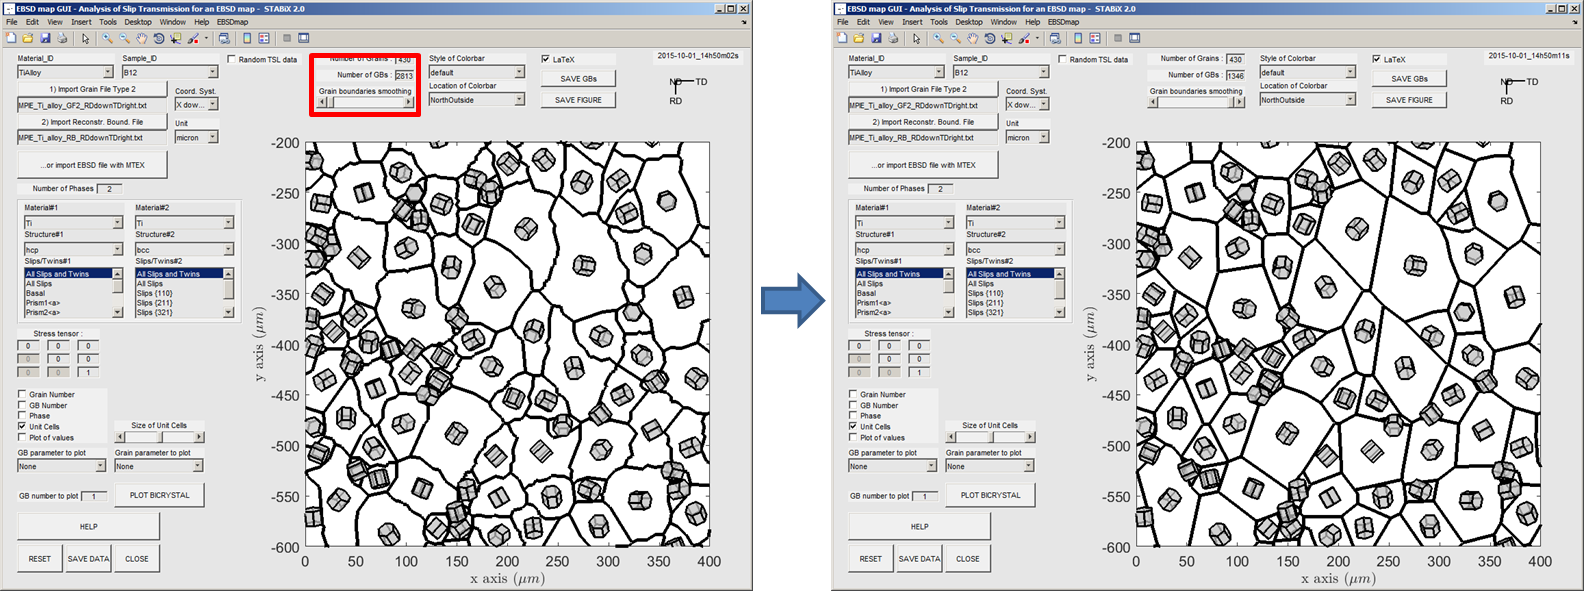
Figure 16 Screenshot of the EBSD map GUI with an EBSD map of near alpha phase Ti alloy a) before smoothing and b) after smoothing.
The Matlab function used to smooth GBs is: interface_map_GB_segments_opti.m
Misorientation angle
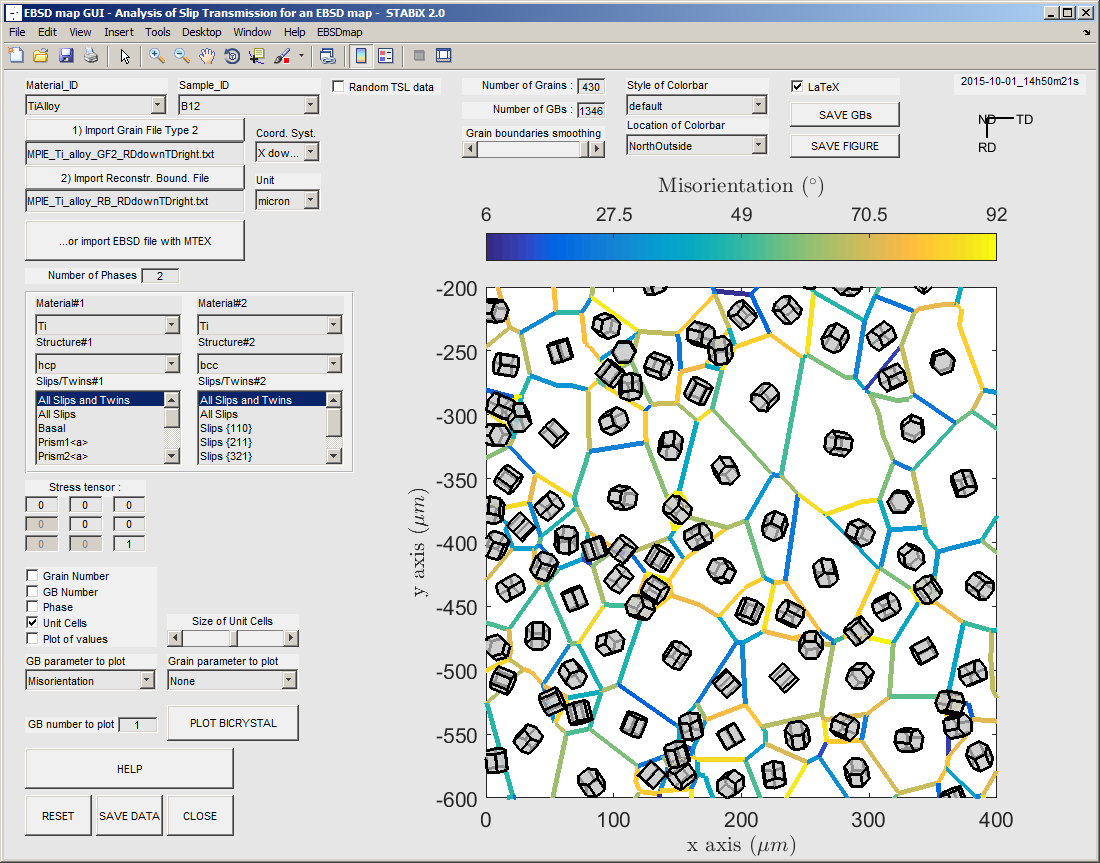
Figure 17 Screenshot of the EBSD map GUI with an EBSD map of near alpha phase Ti alloy (GBs color-coded in function of the maximum misorientation angle value).
m’ parameter
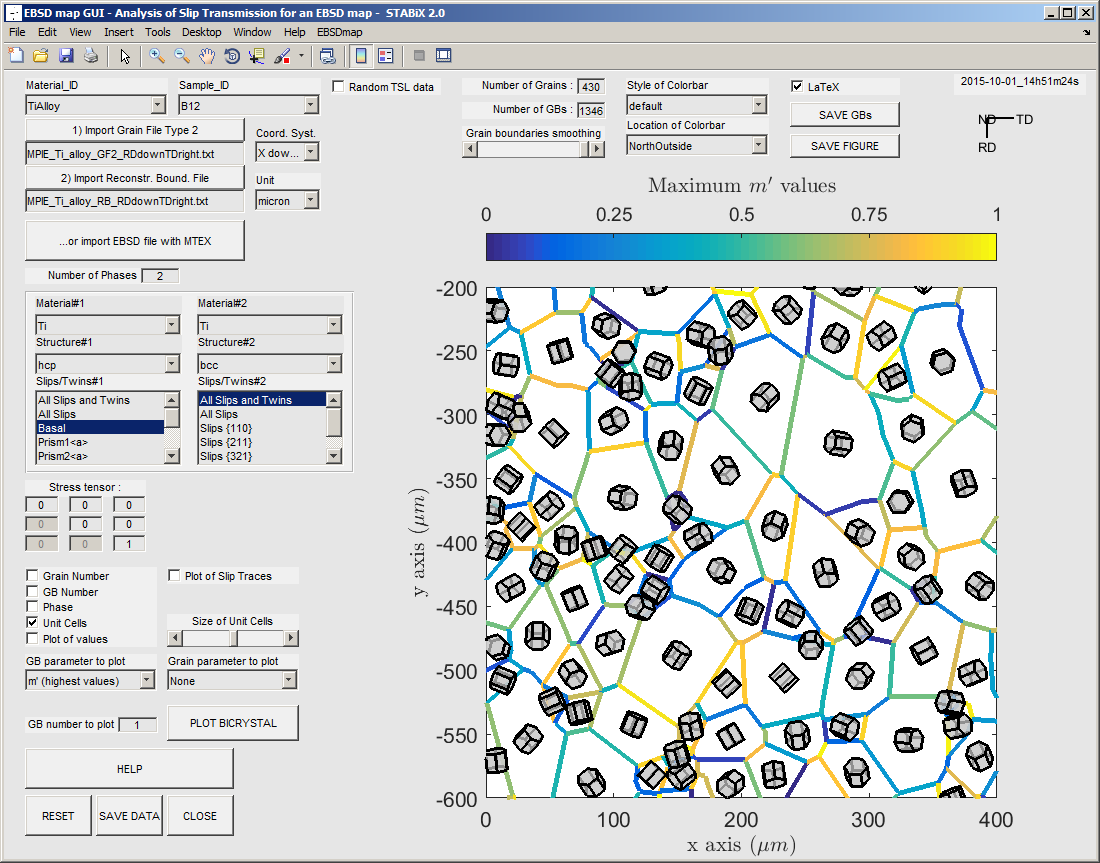
Figure 18 Screenshot of the EBSD map GUI with an EBSD map of near alpha phase Ti alloy (GBs color-coded in function of the maximum m’ value).
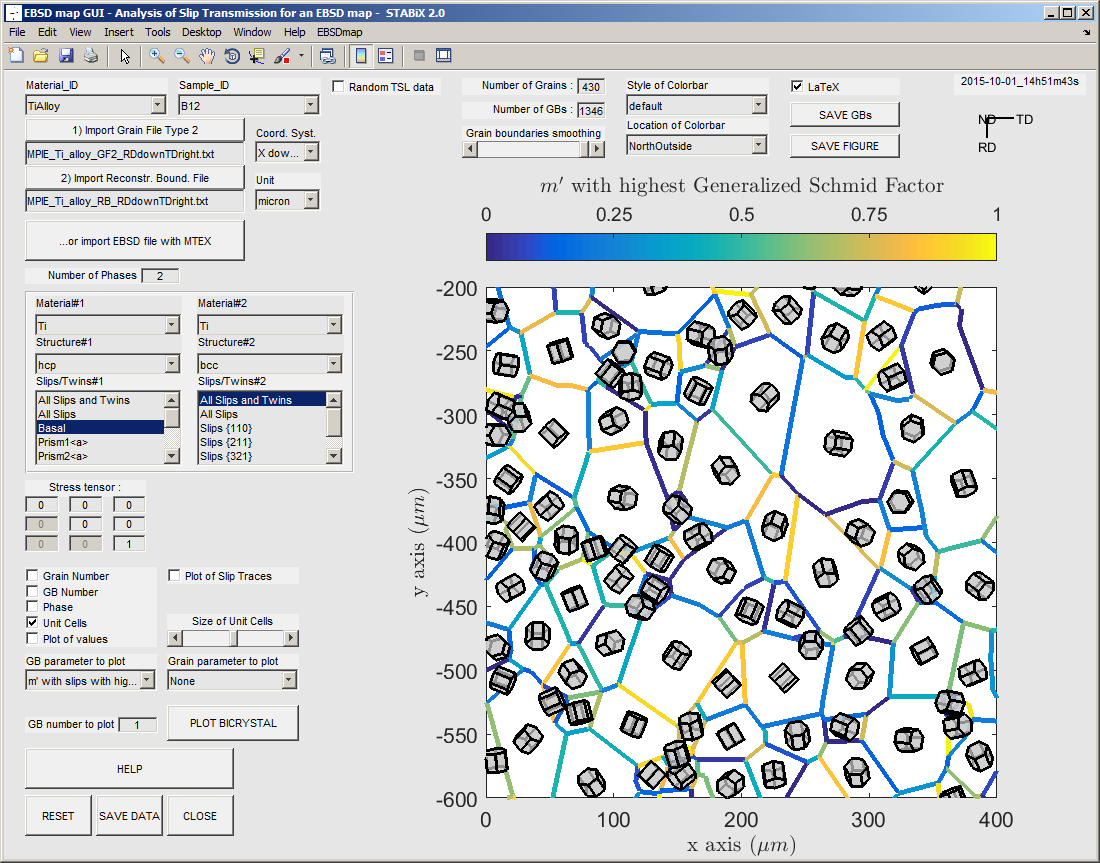
Figure 19 Screenshot of the EBSD map GUI with an EBSD map of near alpha phase Ti alloy (GBs color-coded in function of the maximum m’ value obtained for slips with the highest generalized Schmid factor).
Residual Burgers vector
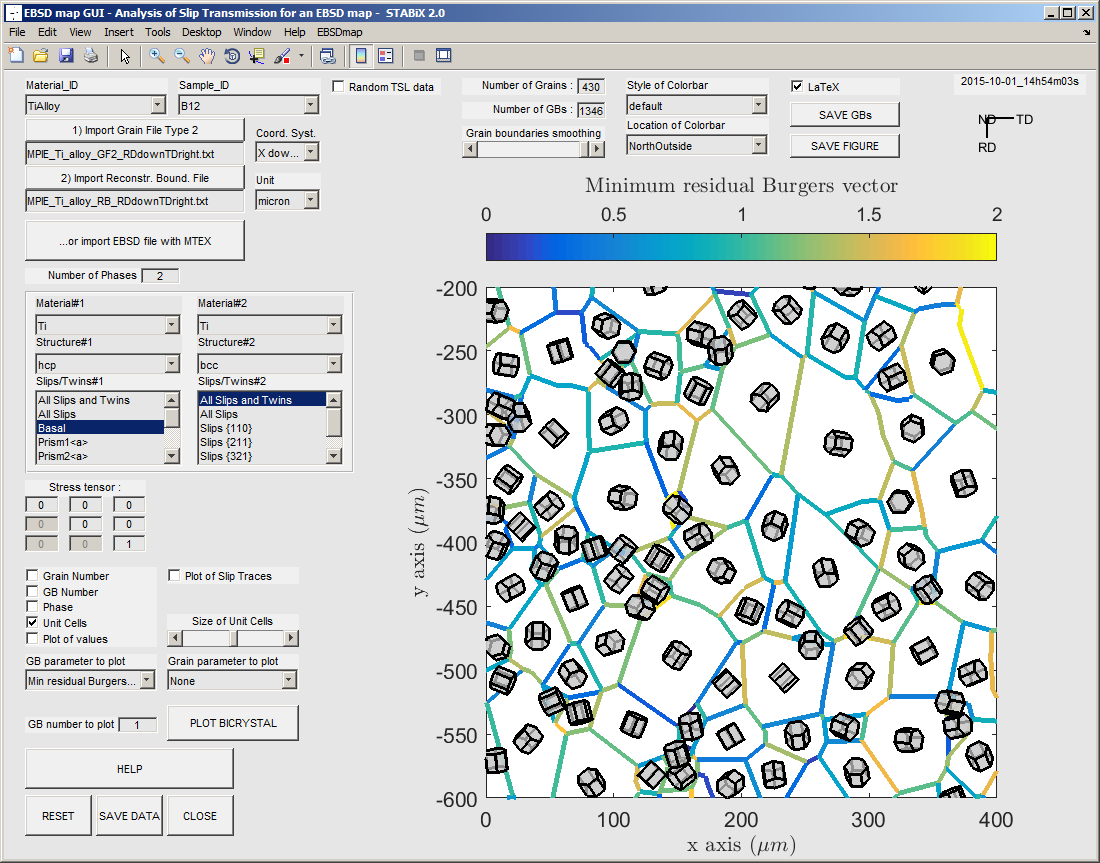
Figure 20 Screenshot of the EBSD map GUI with an EBSD map of near alpha phase Ti alloy (GBs color-coded in function of the maximum residual Burgers vector value).
Schmid factor and slip trace analysis
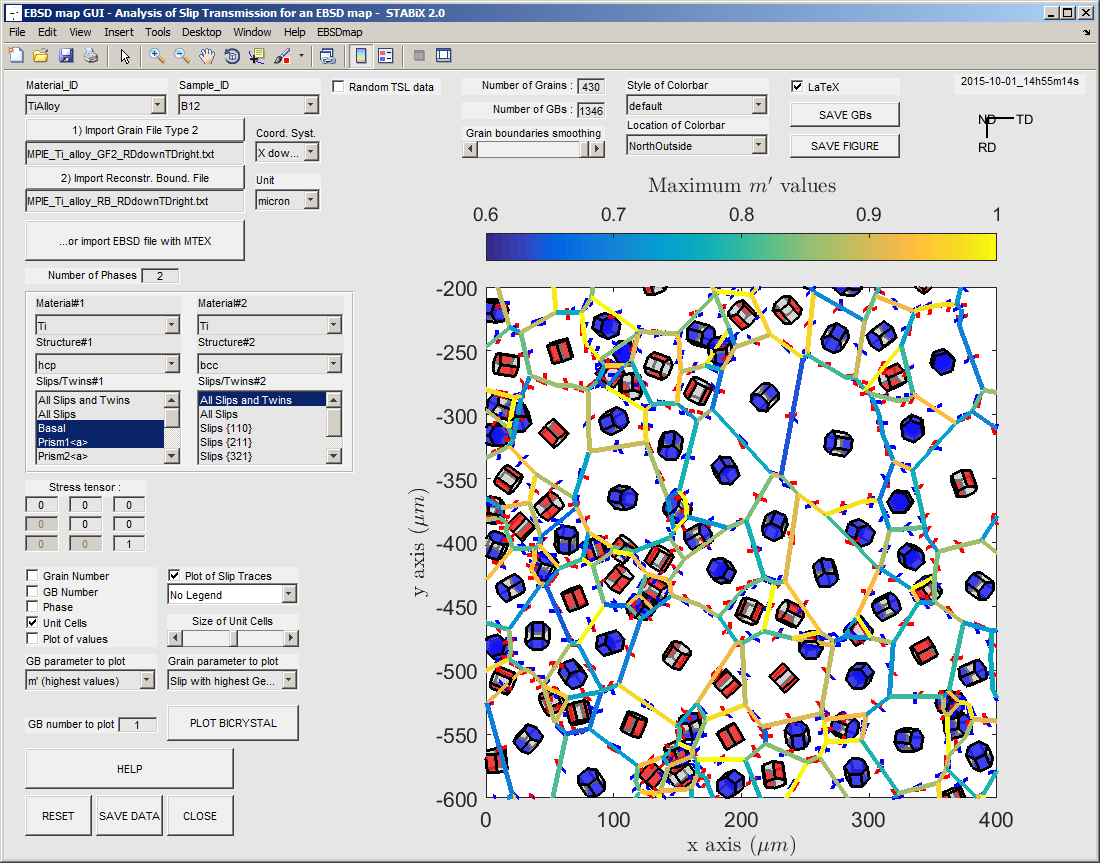
Figure 21 Screenshot of the EBSD map GUI with an EBSD map of near alpha phase Ti alloy (slip plane plotted inside grain and slip trace plotted around unit cells, both in function of the maximum Schmid factor calculated with a given stress tensor).
Plot options
The Matlab function used to plot cell lattice is : vis_lattice.m
It is also possible to plot the structure of octahedral and tetrahedral interstitial defects.
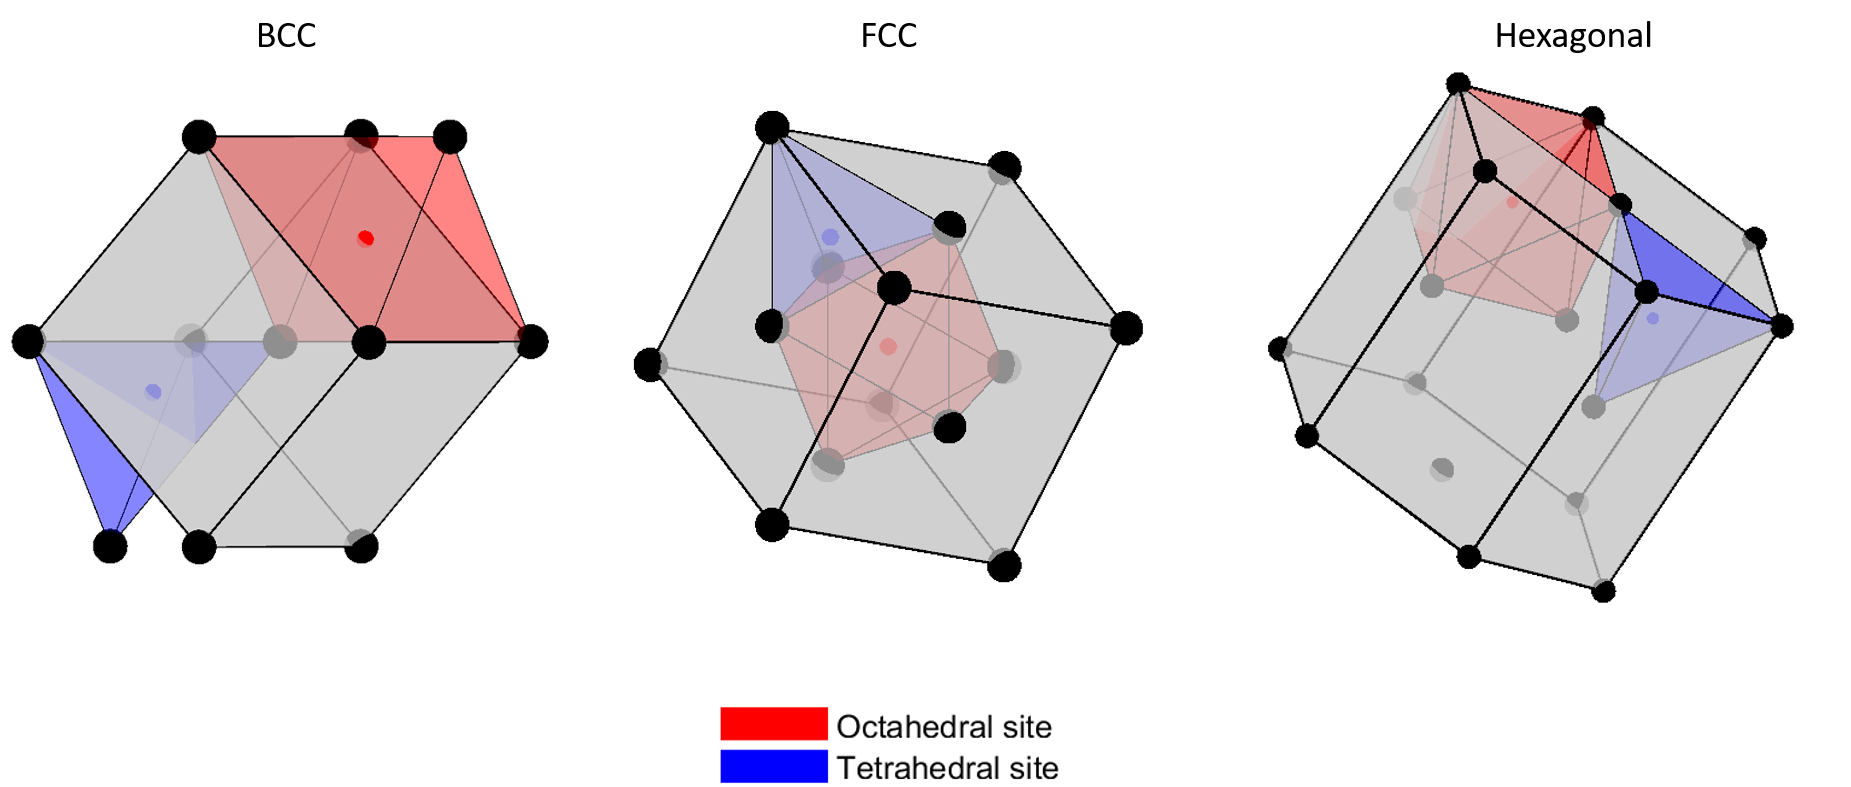
Figure 22 Octahedral (red) and tetrahedral (blue) interstitial symmetry polyhedra in a face-centered cubic, body centered cubic and hexagonal lattices.