Bicrystal GUI
This GUI allows to analyze quantitatively slip transmission across grain boundaries for a single bicrystal.
The Matlab function used to run the Bicrystal GUI is : A_gui_plotGB_Bicrystal.m
This includes:
Loading Bicrystal data
- It is possible to load bicrystal properties (material, phase, Euler angles of both grains, trace angle…) :
from the EBSD map GUI (by giving GB number and pressing the button ‘PLOT BICRYSTAL’) ;
from a YAML config. bicrystal (from the menu, by clicking on ‘Bicrystal, and ‘Load Bicrystal config. file’).
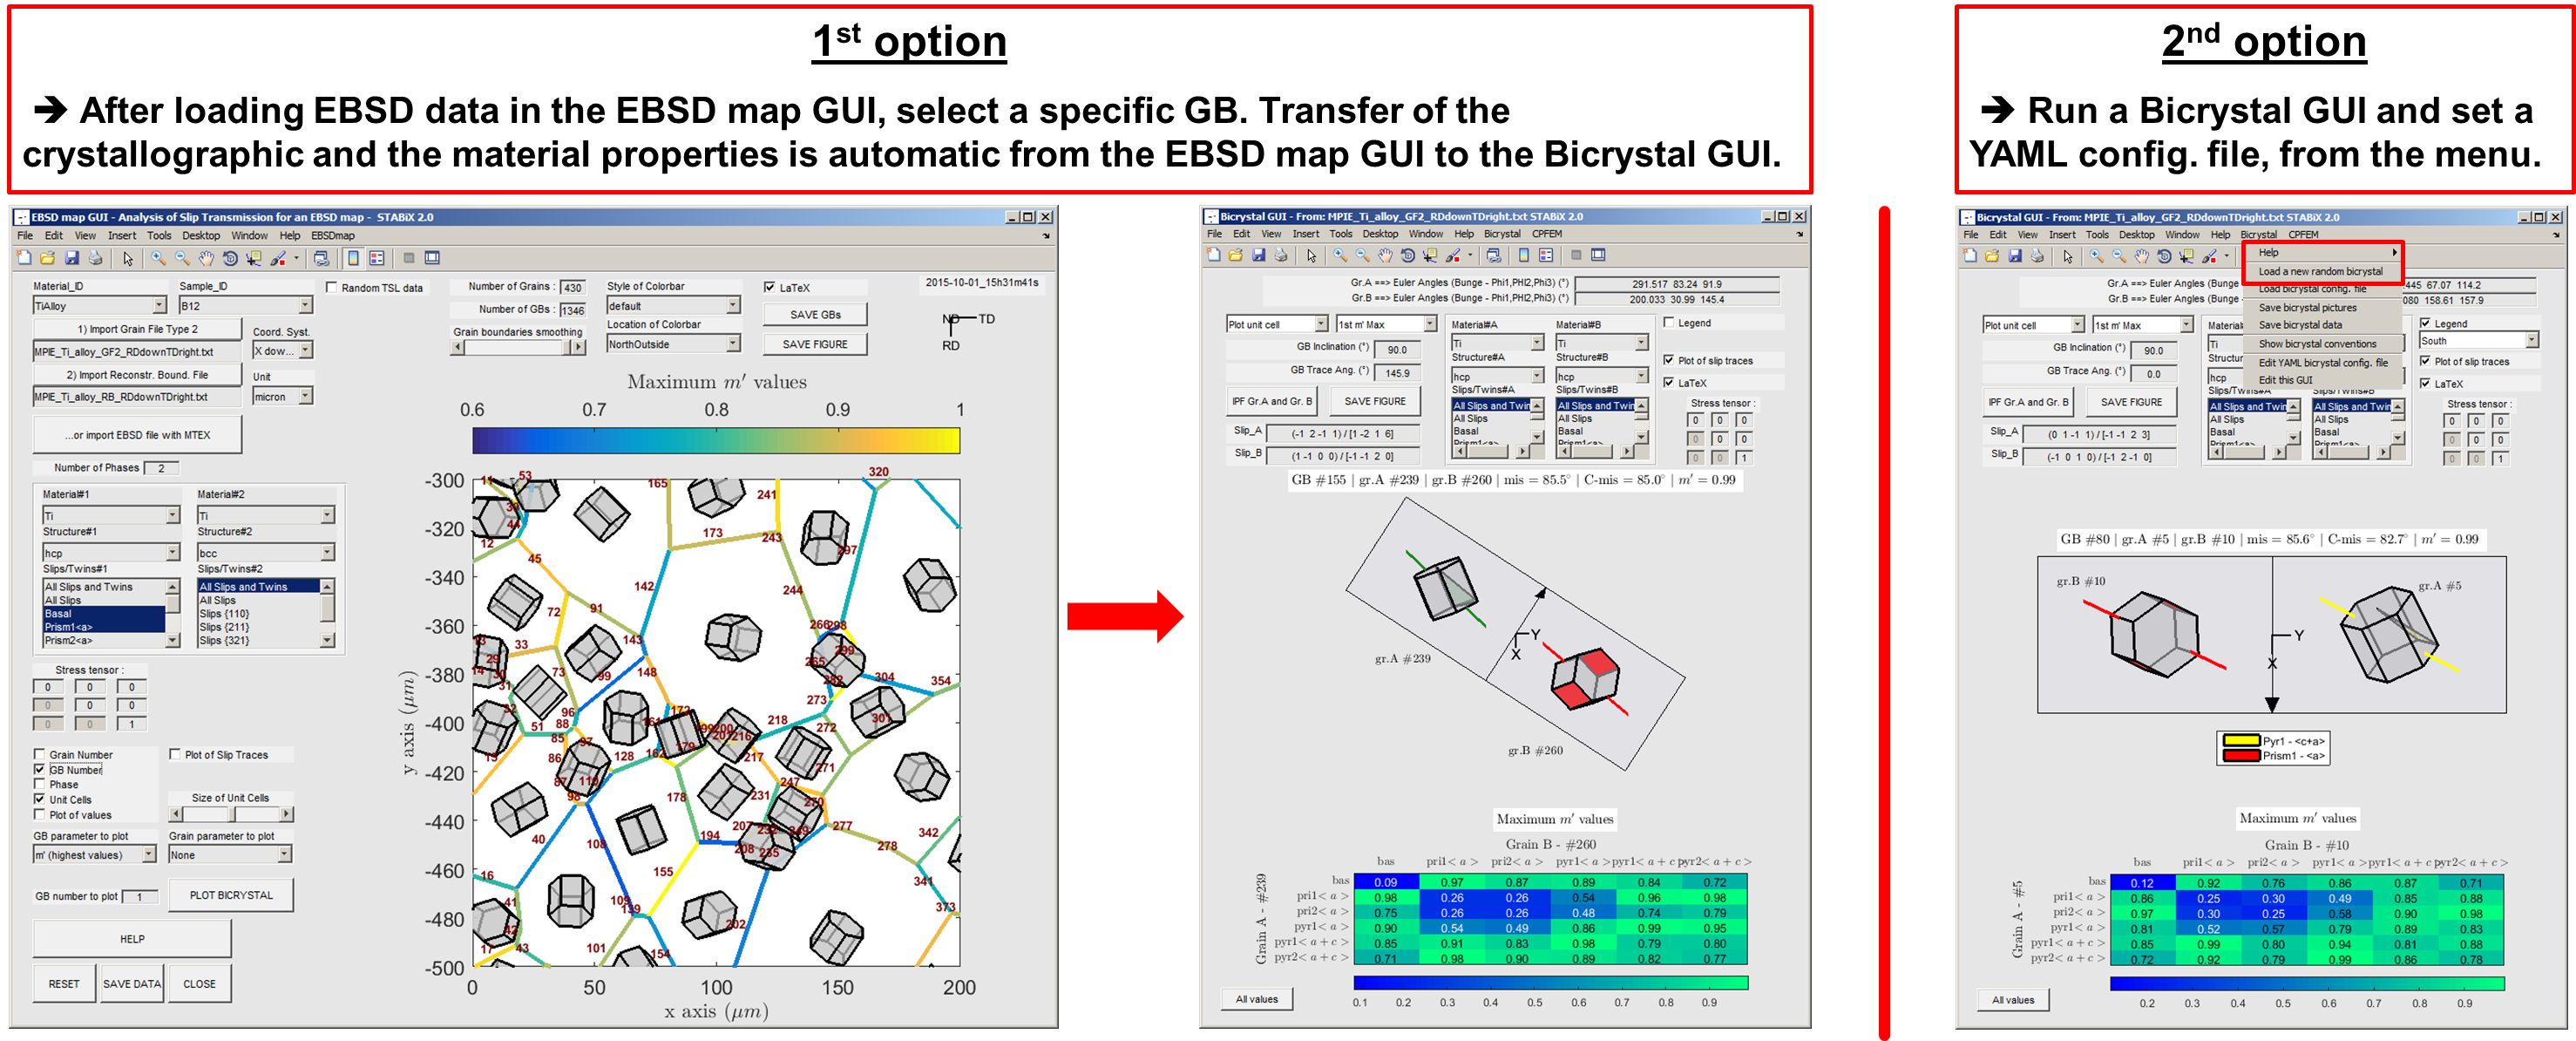
Figure 23 The different steps to set the Bicrystal GUI.
Plotting and analyzing a bicrystal

Figure 24 Screenshot of the Bicrystal GUI.
Distribution of all slip transmission parameters
It is possible to generate a new window, in which all values of the selected slip transmission parameter are plotted in function of selected slip families.
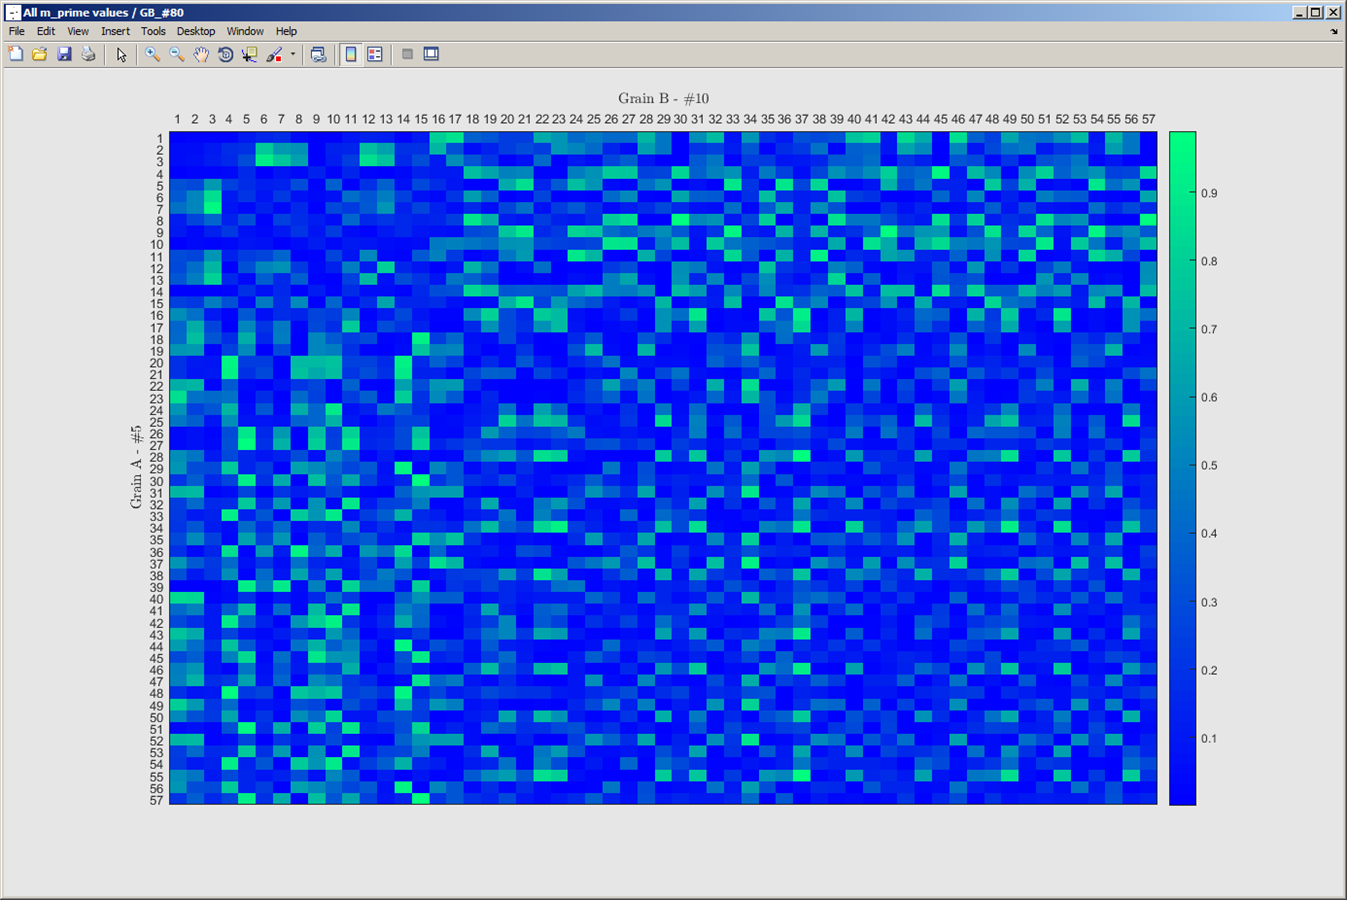
Figure 25 Screenshot of the distribution of all slip transmission parameters (e.g.: m’ parameter for a single phase (HCP) bicrystal).