Analysis of literature data
Please, find here the Matlab functions to analyze results and to plot data from the following papers.
The small differences between values given in the litterature and values found with STABiX toolbox may come from the rounding of Euler angles and the rounding of slip transmission criteria.
Residual Burgers vector
Kacher and Robertson (2012)
Kacher and Robertson analyzed slip transfer in 304 stainless steel (FCC structure), using in situ TEM deformation [3]. In this work, a bicrystal with a misorientation angle of 36° and misorientation axis of [-11, -22, -2] is characterized. Dislocation/grain boundary interactions are analysed and knowing the incoming system, the magnitude of residual dislocation Burgers vector is plotted in function of possible outgoing systems. Calculations are reproduced using the Matlab toolbox and obtained values are compared to Kacher’s results (see Figure 36).
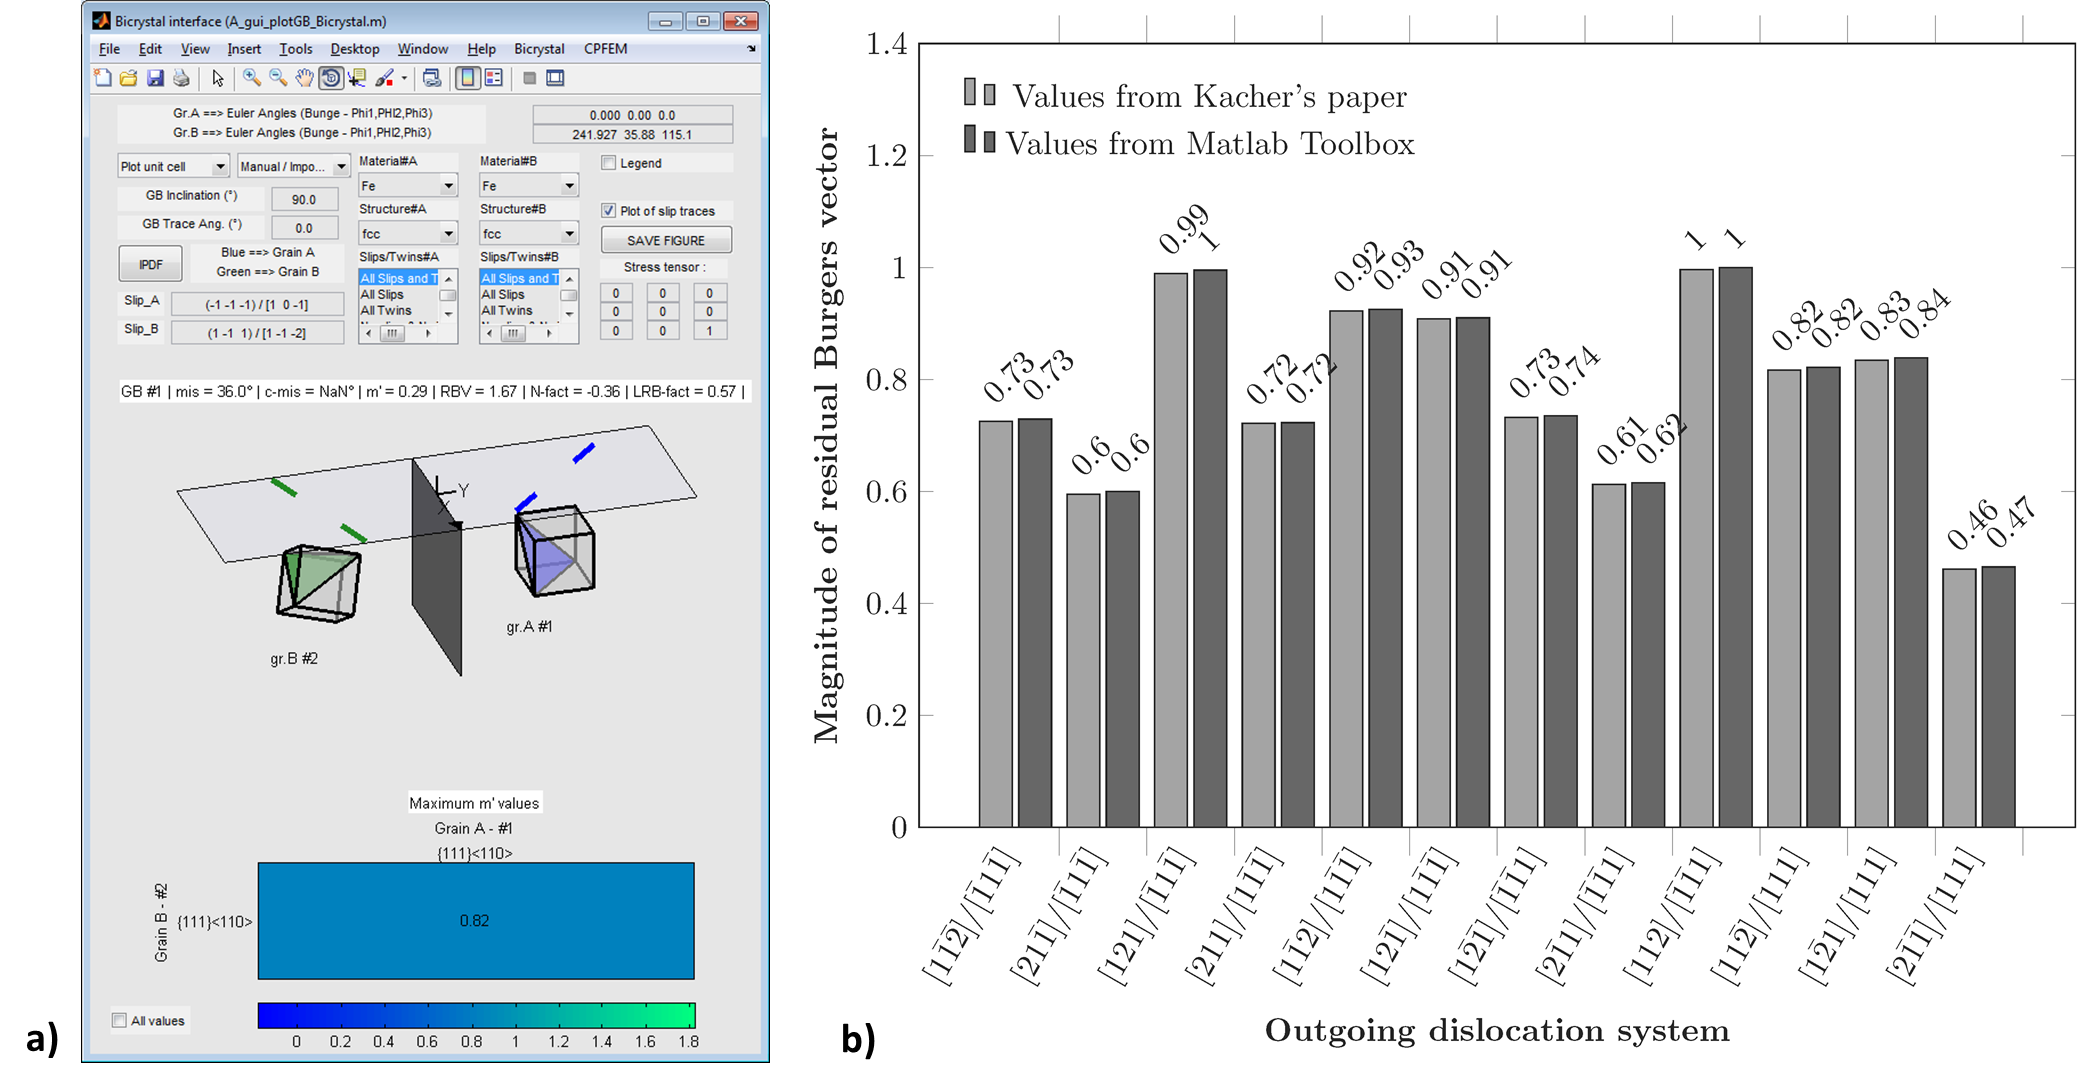
Figure 36 a) Plot of a bicrystal with a misorientation angle of 36° and misorientation axis of [-11, -22, -2] from Kacher’s paper. b) Magnitude of residual Burgers vector given in Kacher’s paper compared to values calculated with the Matlab toolbox.
Patriarca et al. (2013)
Patriarca et al. analysed the deformation response of a FeCr polycrystal (BCC structure) by a combination of EBSD and digital image correlation (DIC) characterizations [6]. The magnitude of residual dislocation Burgers vector is plotted for numerous grain boundaries, knowing incoming and outgoing slips. Calculations are reproduced using the Matlab toolbox and results are compared to Patriarca’s results (see Figure 37).
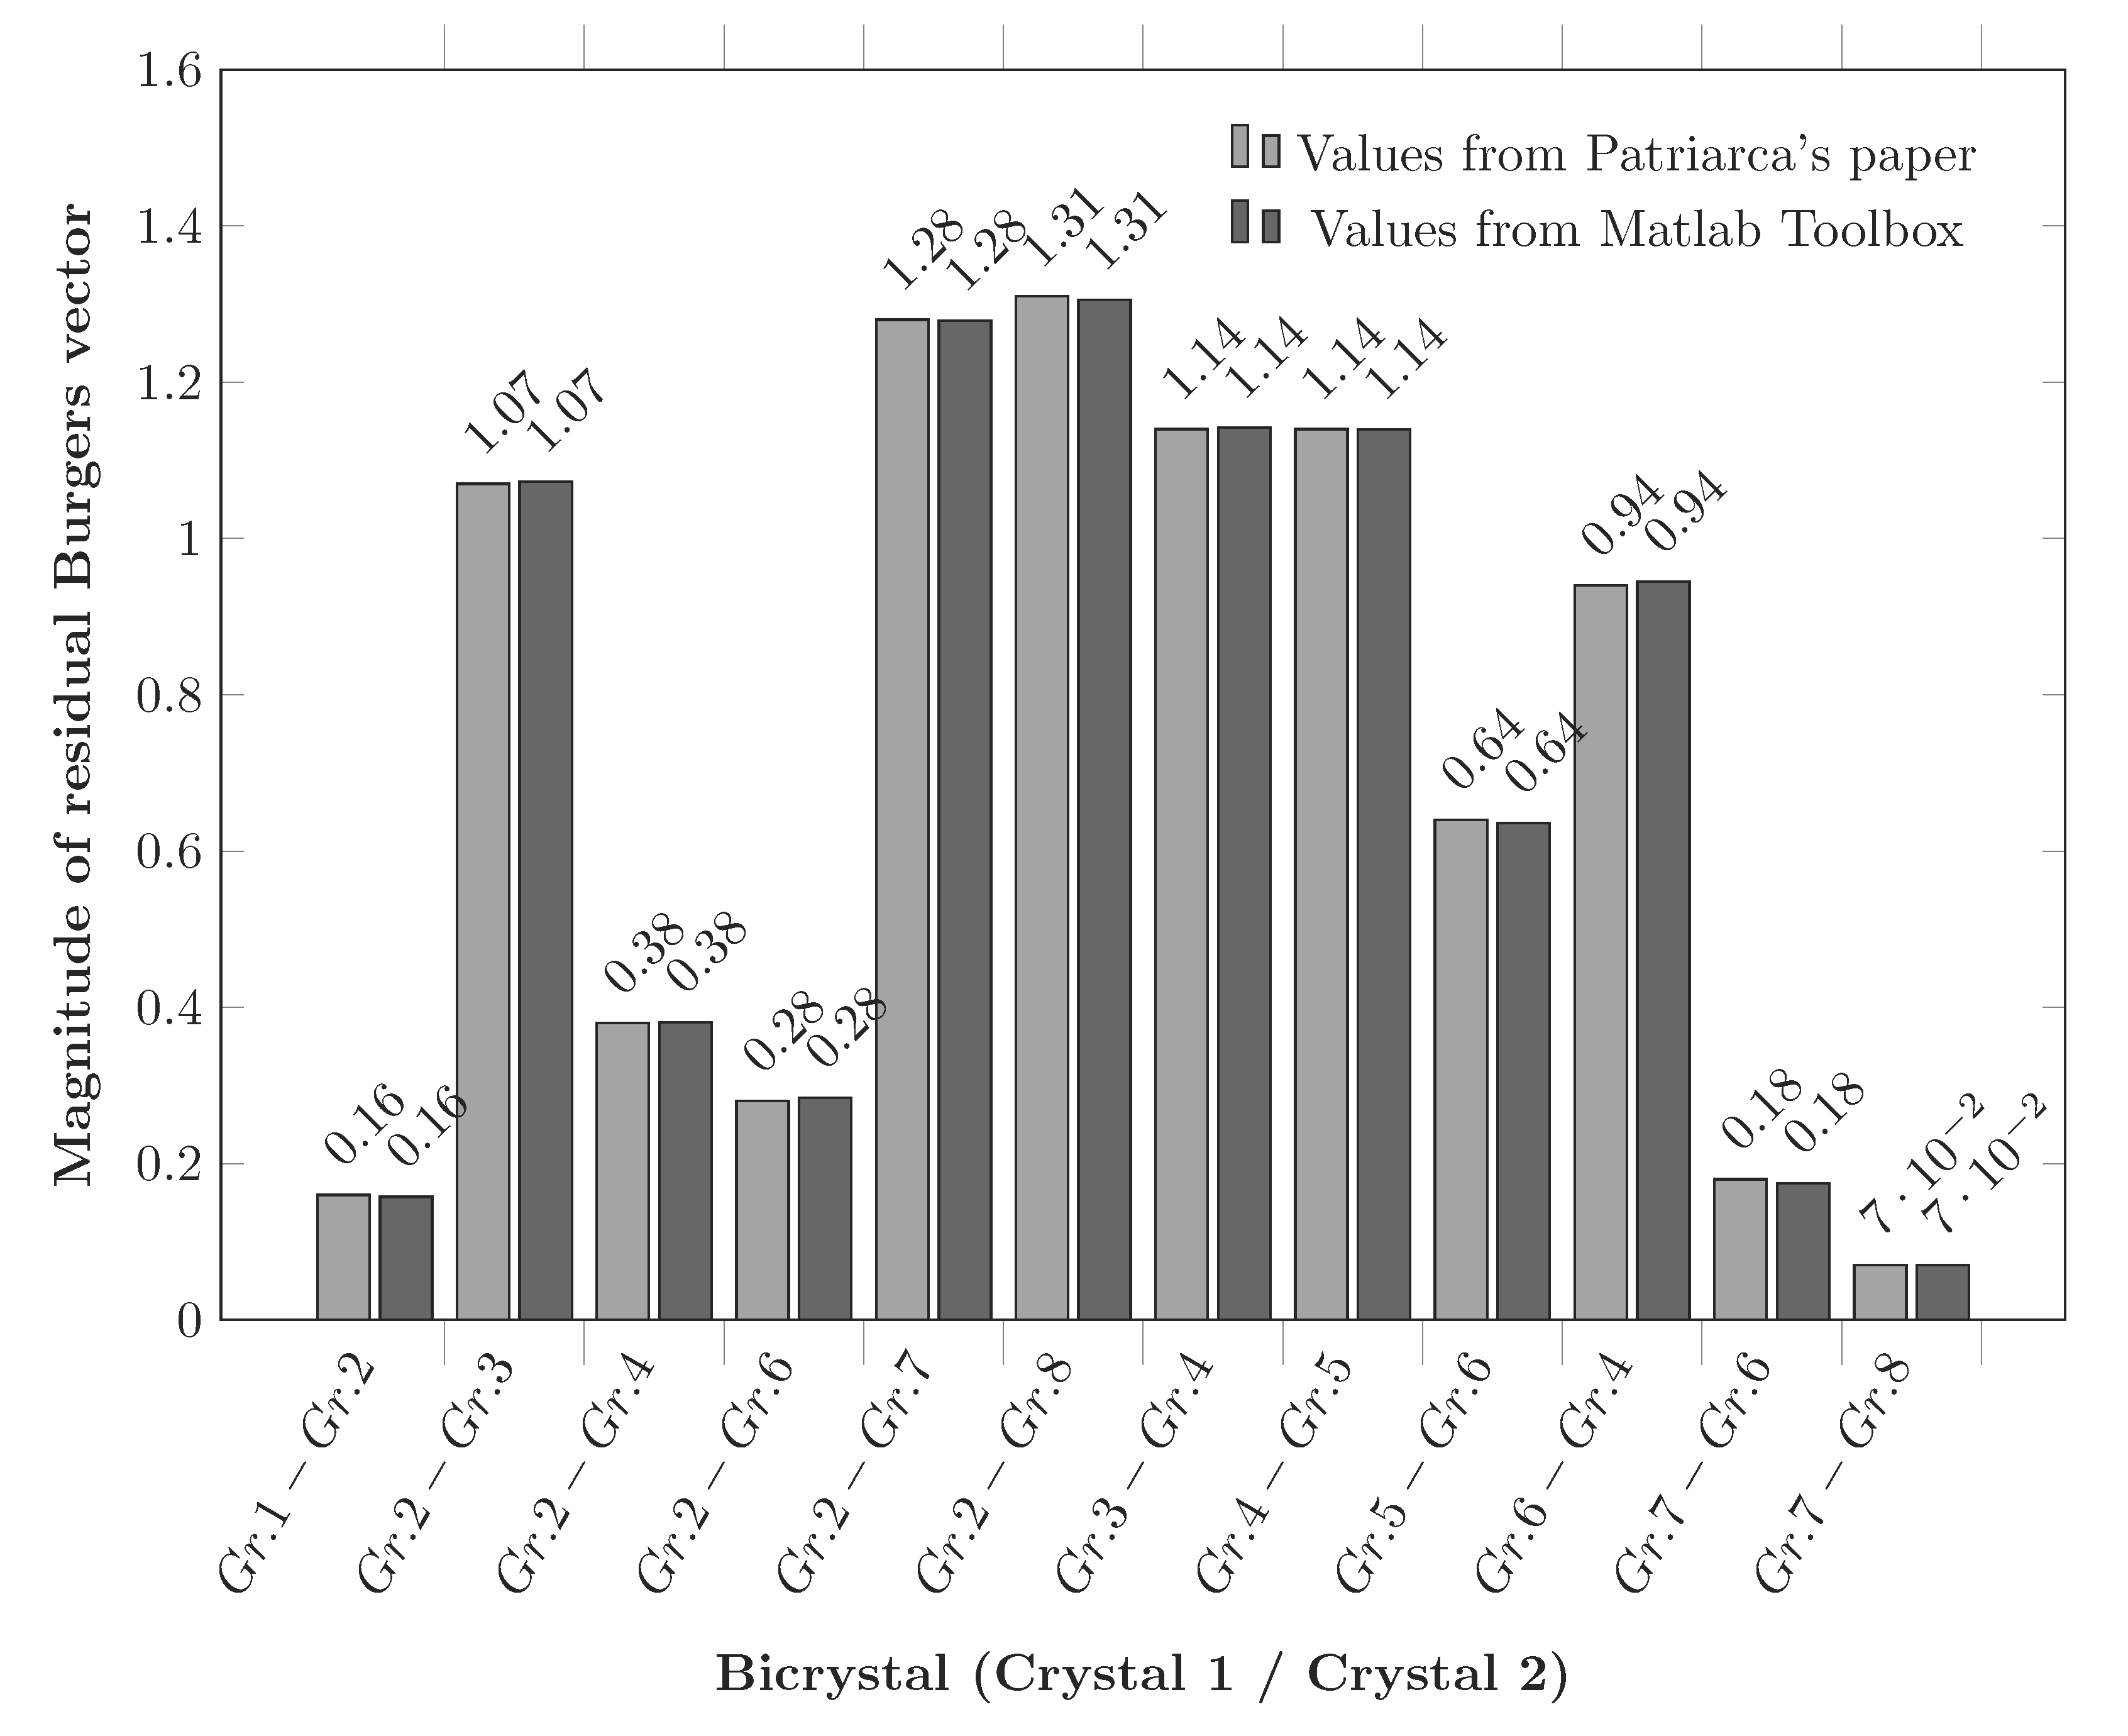
Figure 37 Magnitude of residual Burgers vector given in Patriarca’s paper compared to values calculated with the Matlab toolbox for numerous grain boundaries.
Kacher and Robertson (2014)
Kacher and Robertson analyzed slip transfer in alpha cp-Ti (HCP structure), using in situ TEM deformation [4]. In this work, a bicrystal with a misorientation angle of 32° and misorientation axis of [1, 5, -6, 16] is characterized. Dislocation/grain boundary interactions are analysed and knowing the incoming system, the magnitude of residual dislocation Burgers vector is plotted in function of possible outgoing systems. Calculations are reproduced using the Matlab toolbox and obtained values are compared to Kacher’s results (see Figure 38).
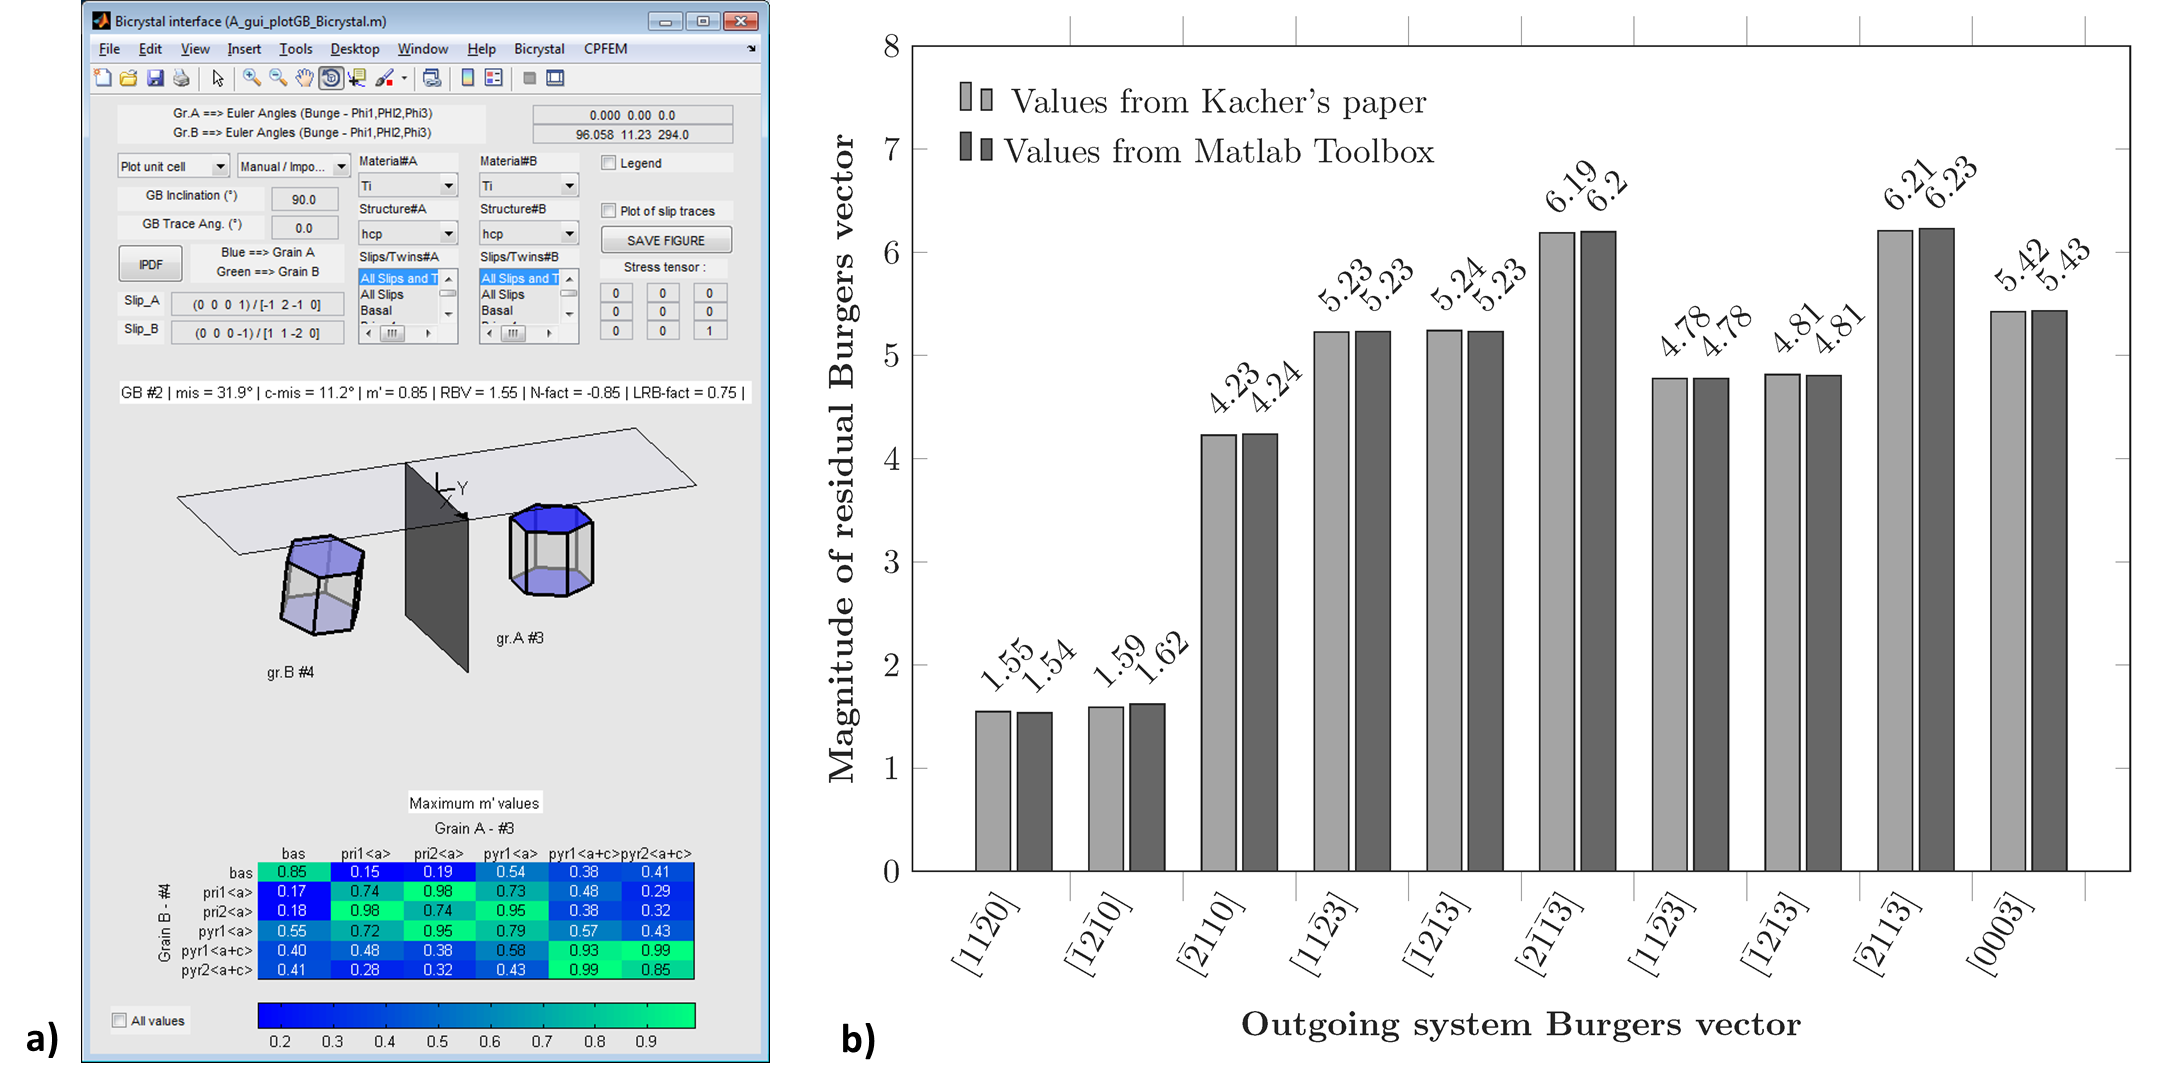
Figure 38 a) Plot of a bicrystal with a misorientation angle of 32° and misorientation axis of [1, 5, -6, 16] from Kacher’s paper. b) Magnitude of residual Burgers vector given in Kacher’s paper compared to values calculated with the Matlab toolbox for the bicrystal #2.
Cui et al. (2014)
Cui et al. analyzed slip transfer in proton-irradiated 13Cr15Ni stainless steel (fcc structure), using in situ TEM deformation [1]. In this work, two bicrystals with respectively a misorientation angles of 60° and 40° and a misorientation axis of [1, 1, -1] and [1, 0, 1] are characterized. Dislocation/grain boundary interactions are analysed and knowing the incoming system, the magnitude of residual dislocation Burgers vector is plotted in function of possible outgoing systems. Calculations are reproduced using the Matlab toolbox and obtained values are compared to Cui’s results (see Figure 39).
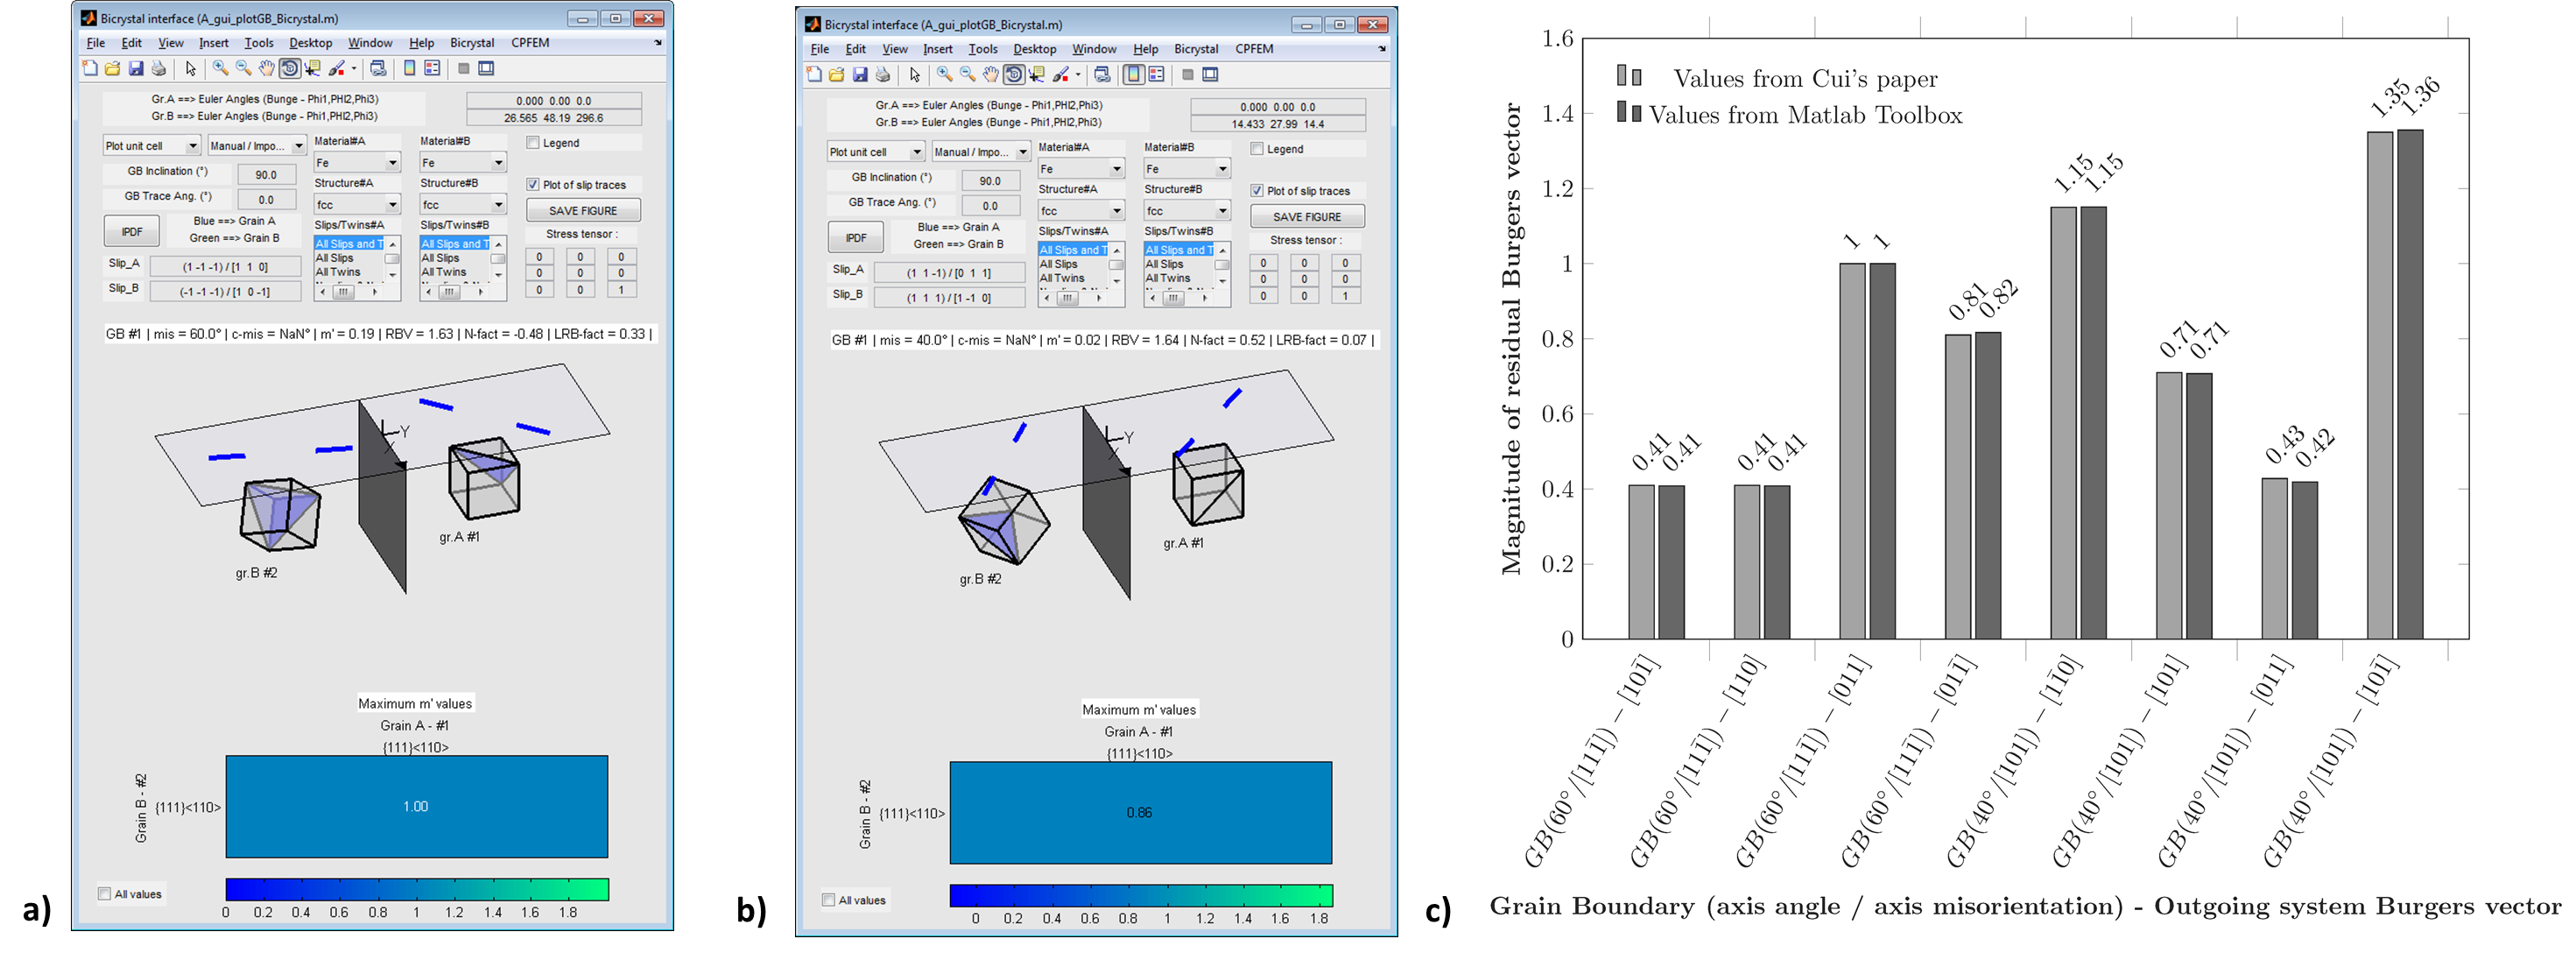
Figure 39 a) Plot of a bicrystal with a misorientation angle of 60° and misorientation axis of [1, 1, -1] from Cui’s paper. b) Plot of a bicrystal with a misorientation angle of 40° and misorientation axis of [1, 0, 1] from Cui’s paper. c) Magnitude of residual Burgers vector given in Cui’s paper compared to values calculated with the Matlab toolbox for the two bicrystals.
m’ factor
Guo et al. (2014)
Guo et al. analyzed slip transfer in cp-Ti (HCP structure), by tensile test combined to in situ digital image correlation (DIC) [2]. In this work, many bicrystals are characterized and slip band–grain boundary interactions are analyzed in term of stress concentration along the slip plane direction. The \(m'\) factor is used to quantify the transmissivity across the GBs and calculations are reproduced using the Matlab toolbox (see Figure 40).
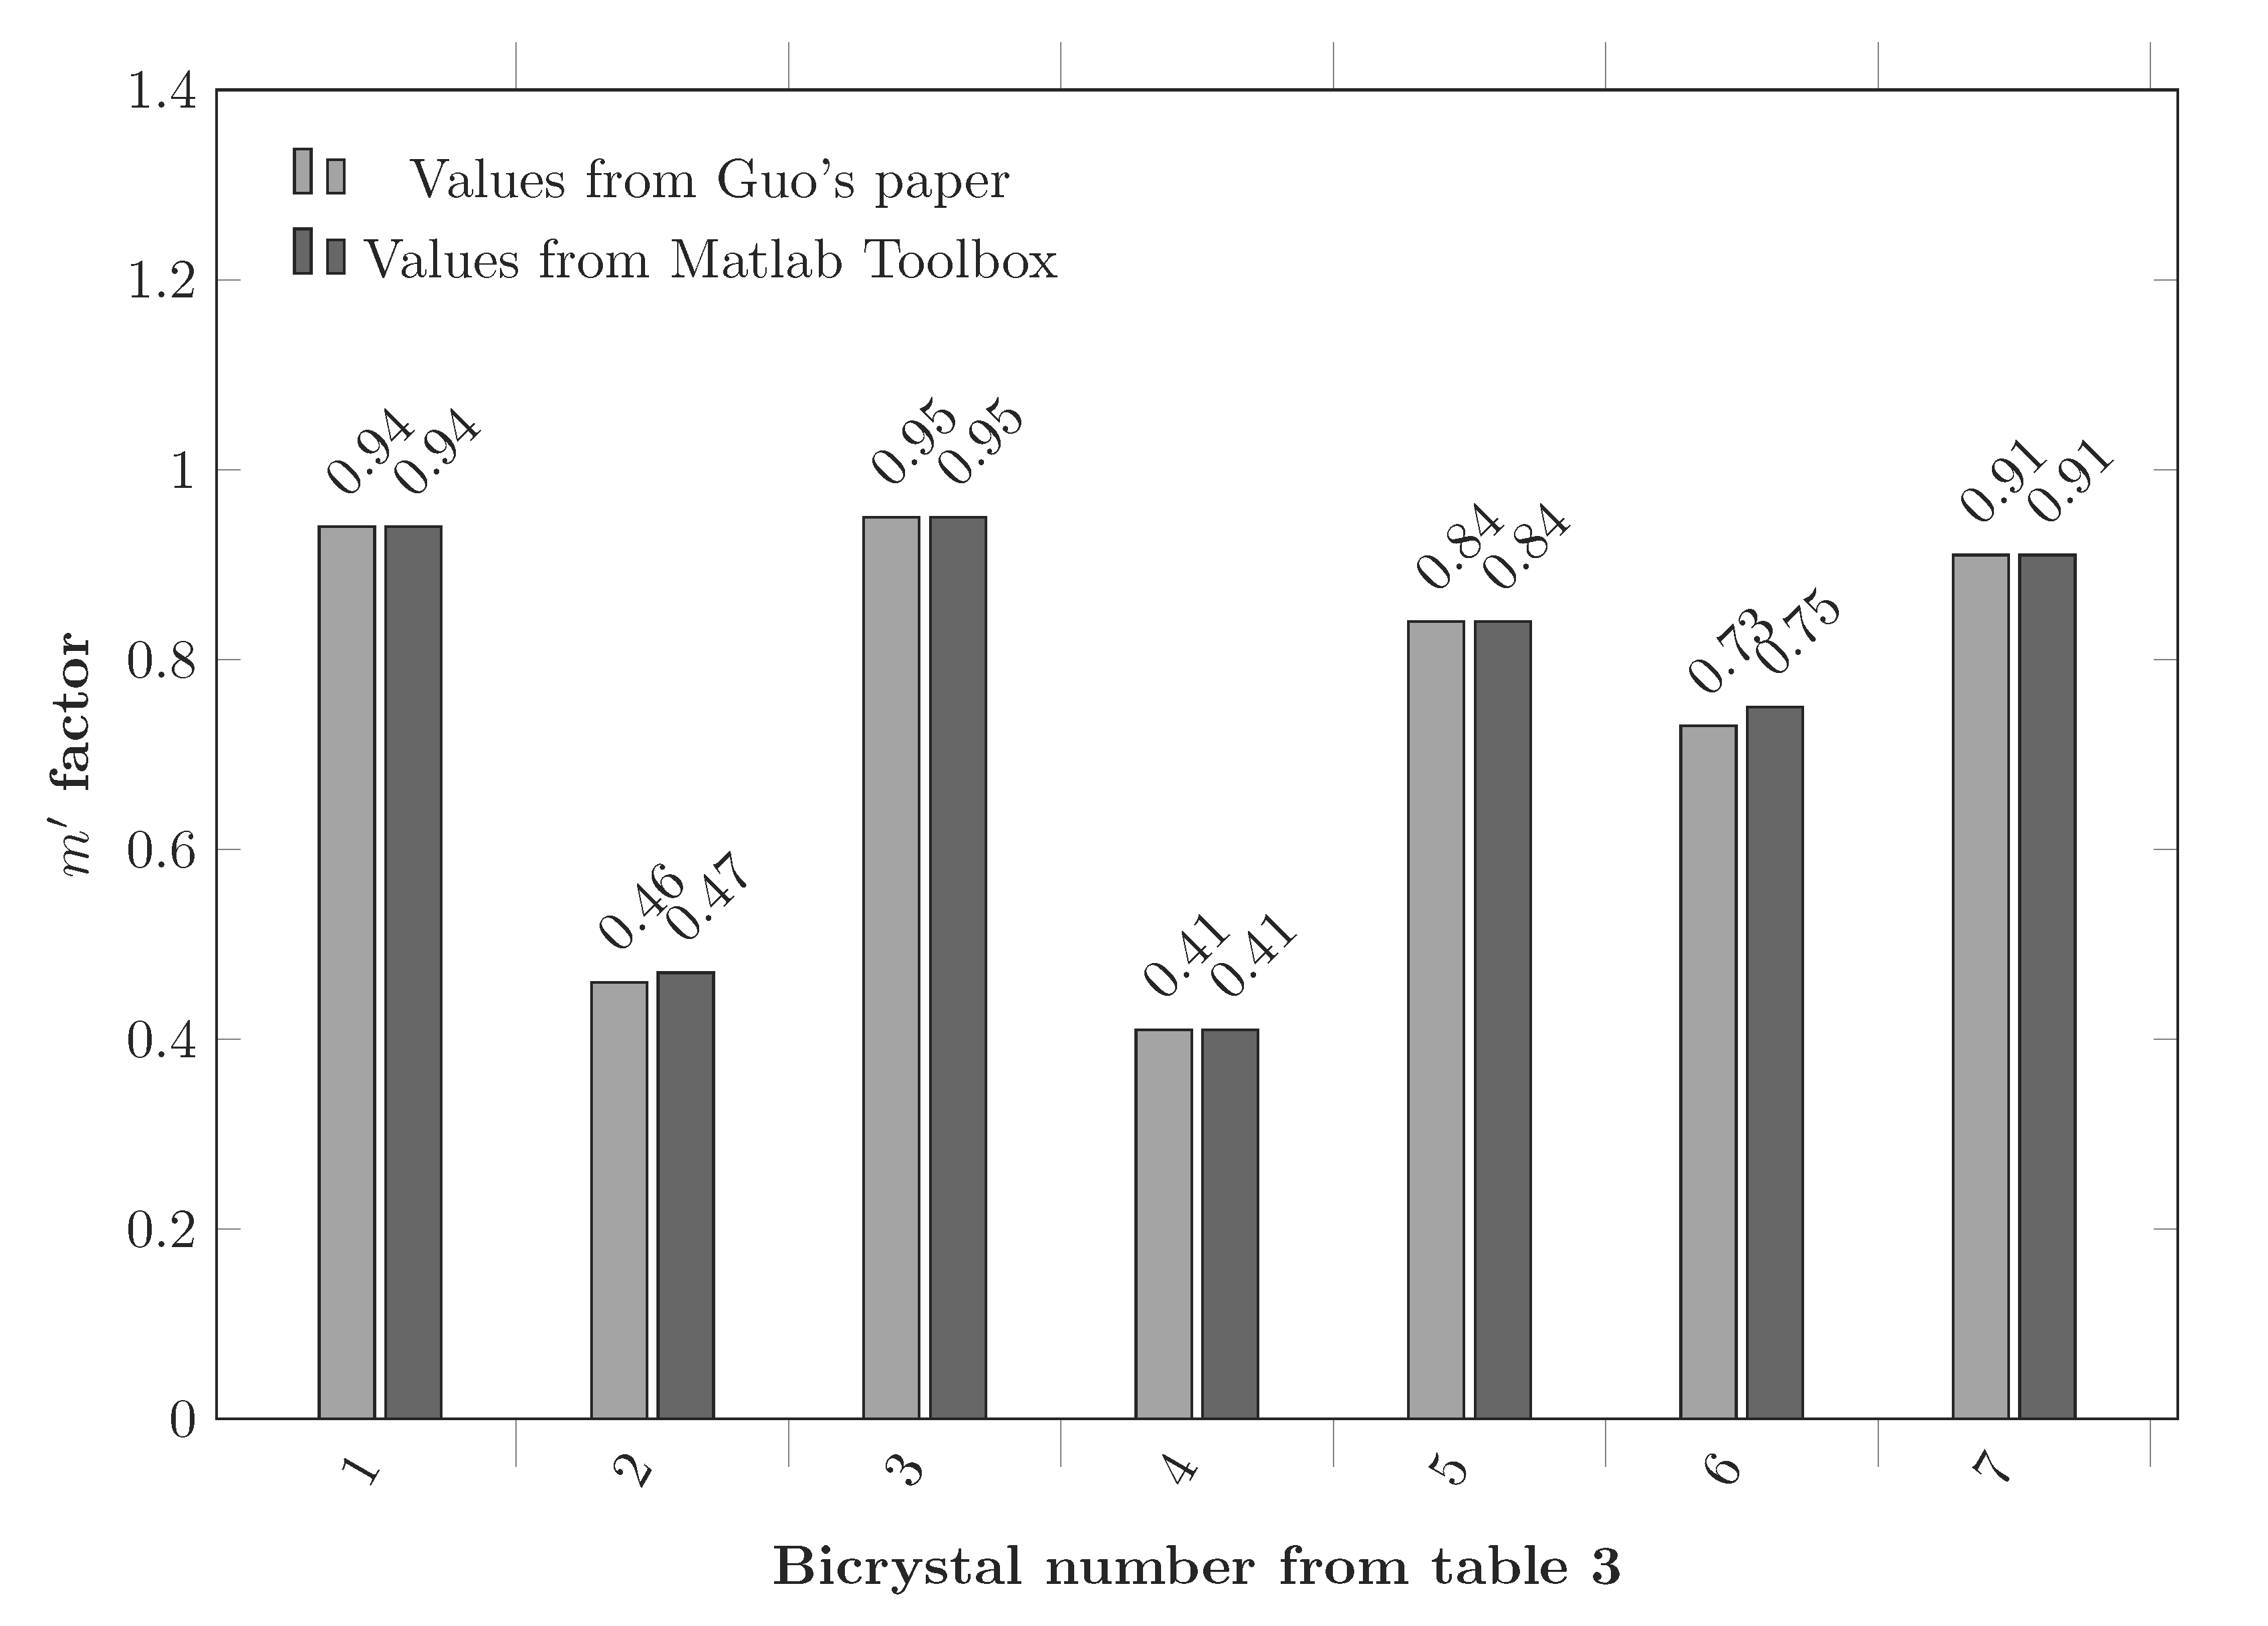
Figure 40 m’ factor values given in Guo’s paper compared to values calculated with the Matlab toolbox for 7 different bicrystals.